Feature Platform Case Study
Project: Part 1: Usability Study
Part 2: Redesign of the Feature Platform overview Page + New Metadata Page
Target User: Data Scientists, Data Engineers, and Data Analysts
Role: Lead UX/UI designer
Part 1: Feature Platform Usability Study
Goal: The Feature platform is part of a machine learning ecosystem that powers machine learning models that aide in making better business decisions, that include keeping customers safe from fraud and also solve for overall customer needs. Features are inputs into a model. Consumers need to know that feature code is compliant, performant and trustworthy before feature reuse. A quality tiering system was set in place to help users distinguish quality between features on the Ecosystem’s UI to use in their models and not rely on tribal knowledge.
Challenge: Teams create internal tools to solve their immediate needs, but end up duplicating efforts across the enterprise. This leads to navigating multiple complex systems that do not communicate with each other, leading to inefficiencies and most importantly risk. From a consumer standpoint, experience is compromised leading to a lack of trust.
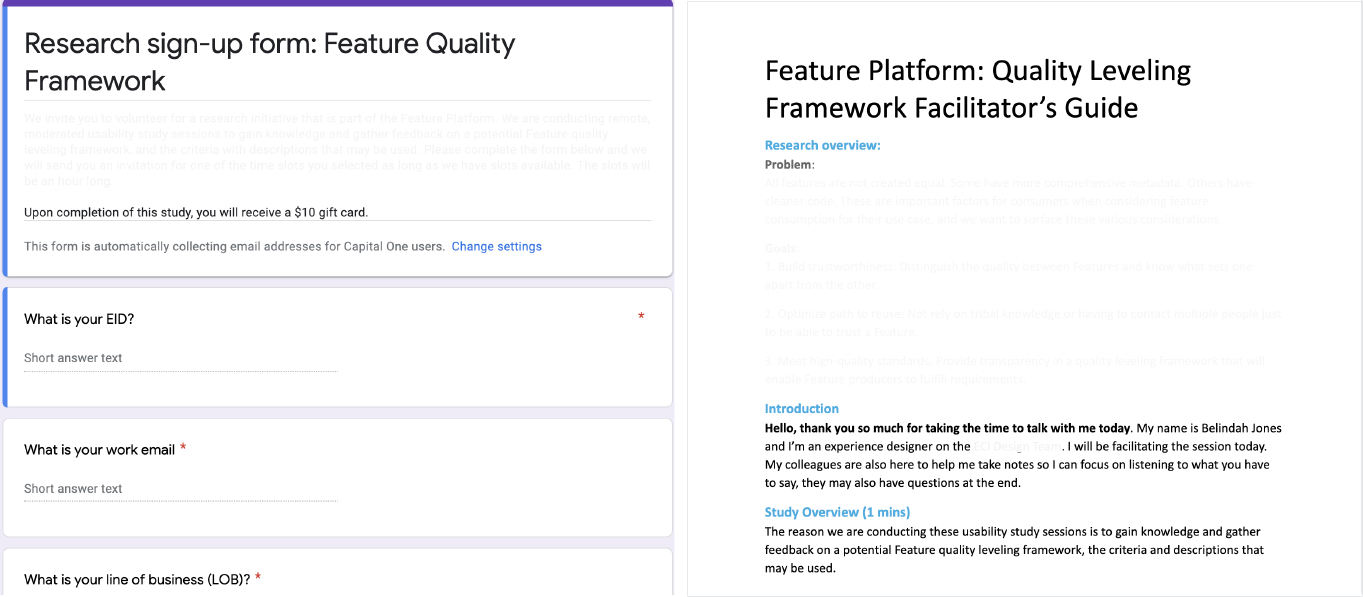
Outcomes: In order to build trust from both producers and consumers, I planned, and facilitated 7 usability study sessions with data scientists and data analysts from different lines of business. The study focused on gaining knowledge and gathering feedback on a potential binary leveling framework - strong or premium. Screeners were sent out to recruit users who met certain criteria specific to features within the ecosystem. I collaborated with my business and tech partners from the facilitator script, to recruitment.
7 Interviews
4 Data Scientists
3 Data Analysts
Tasks included:
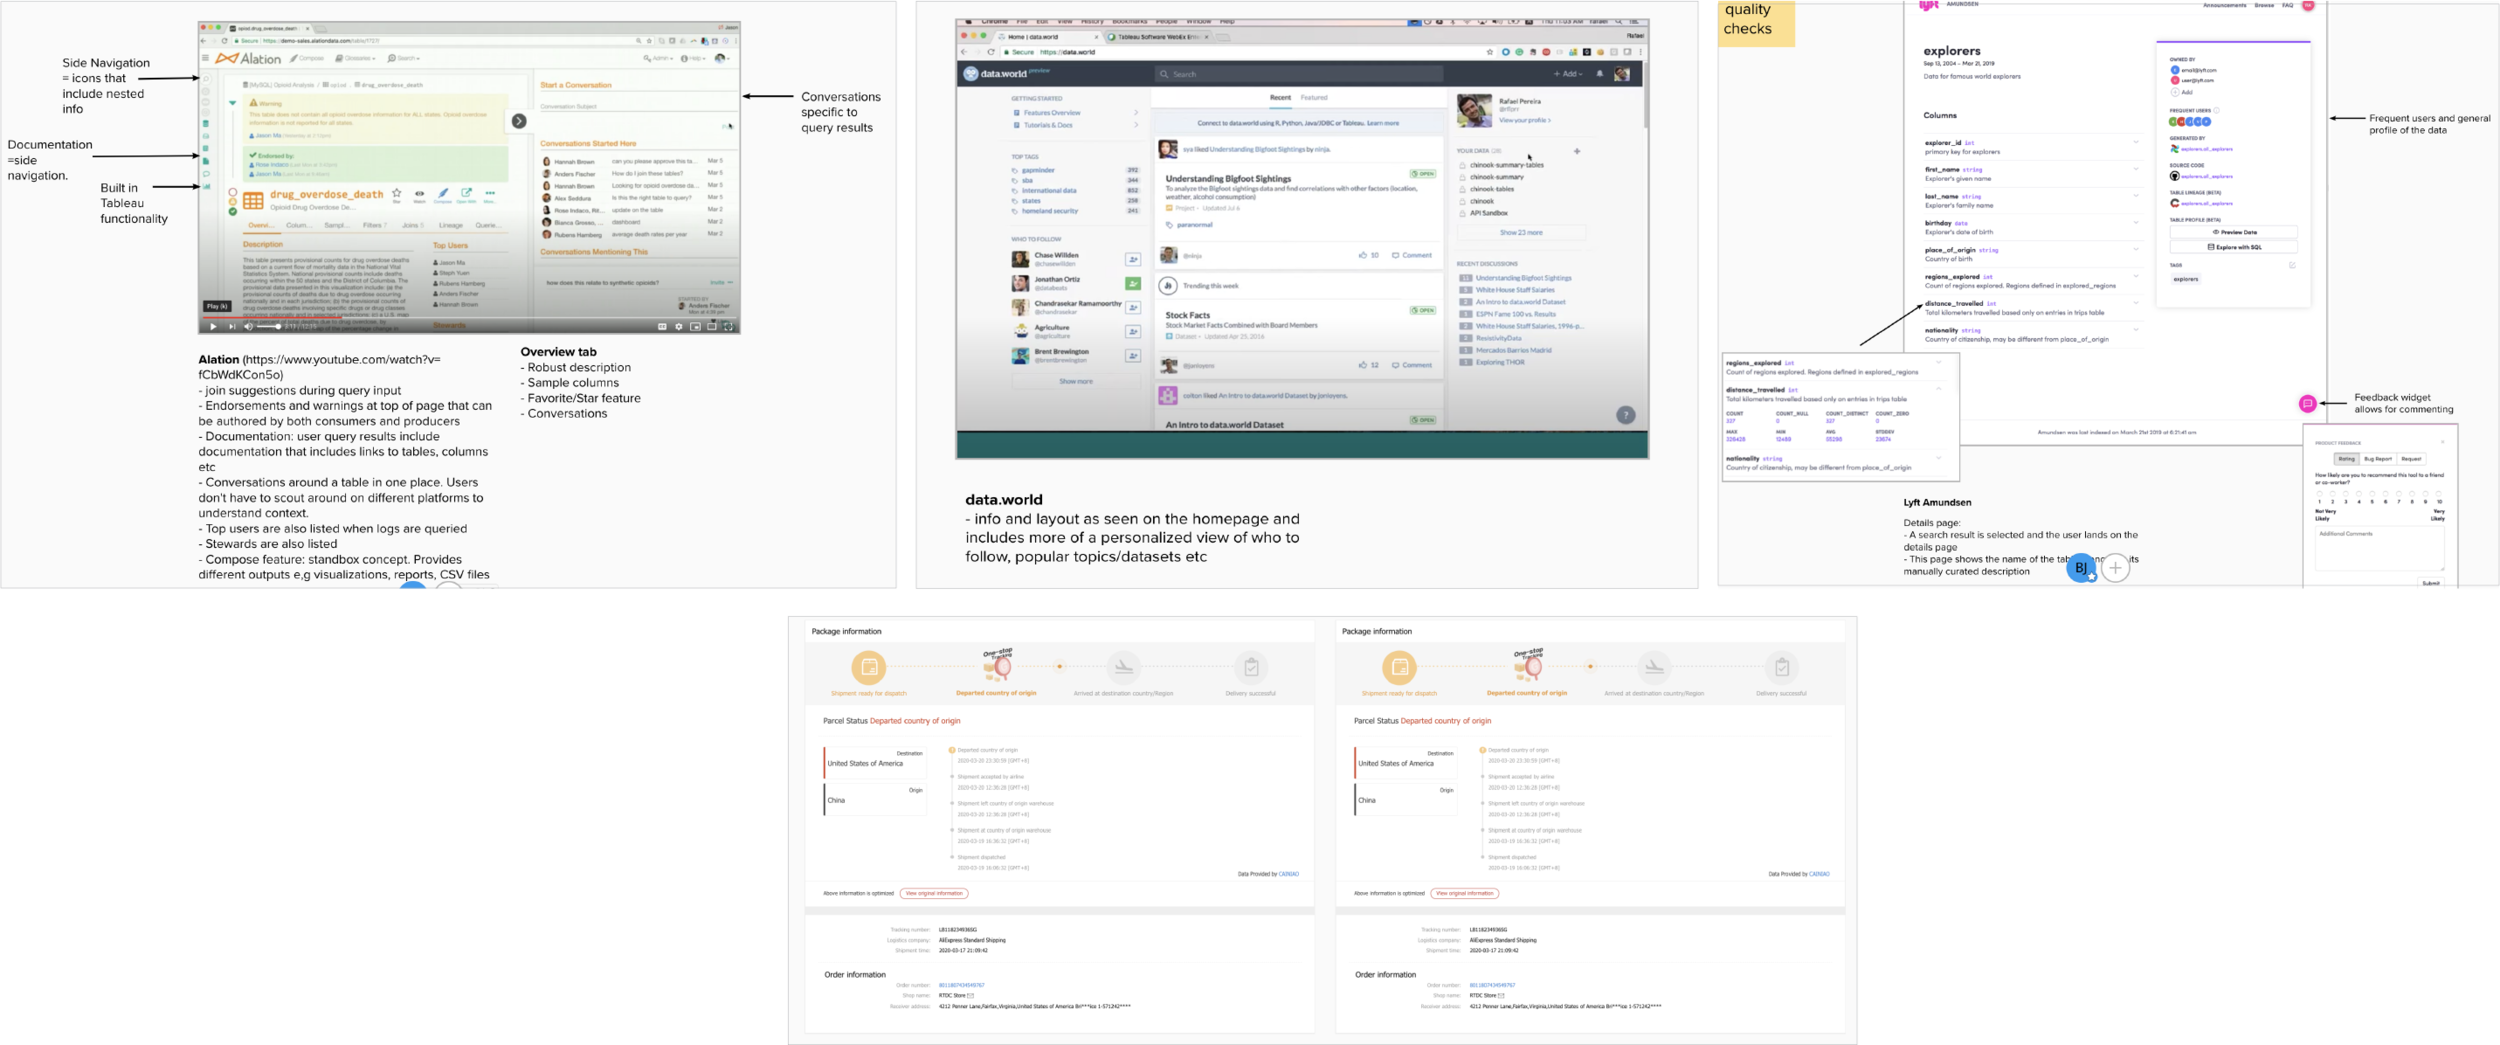
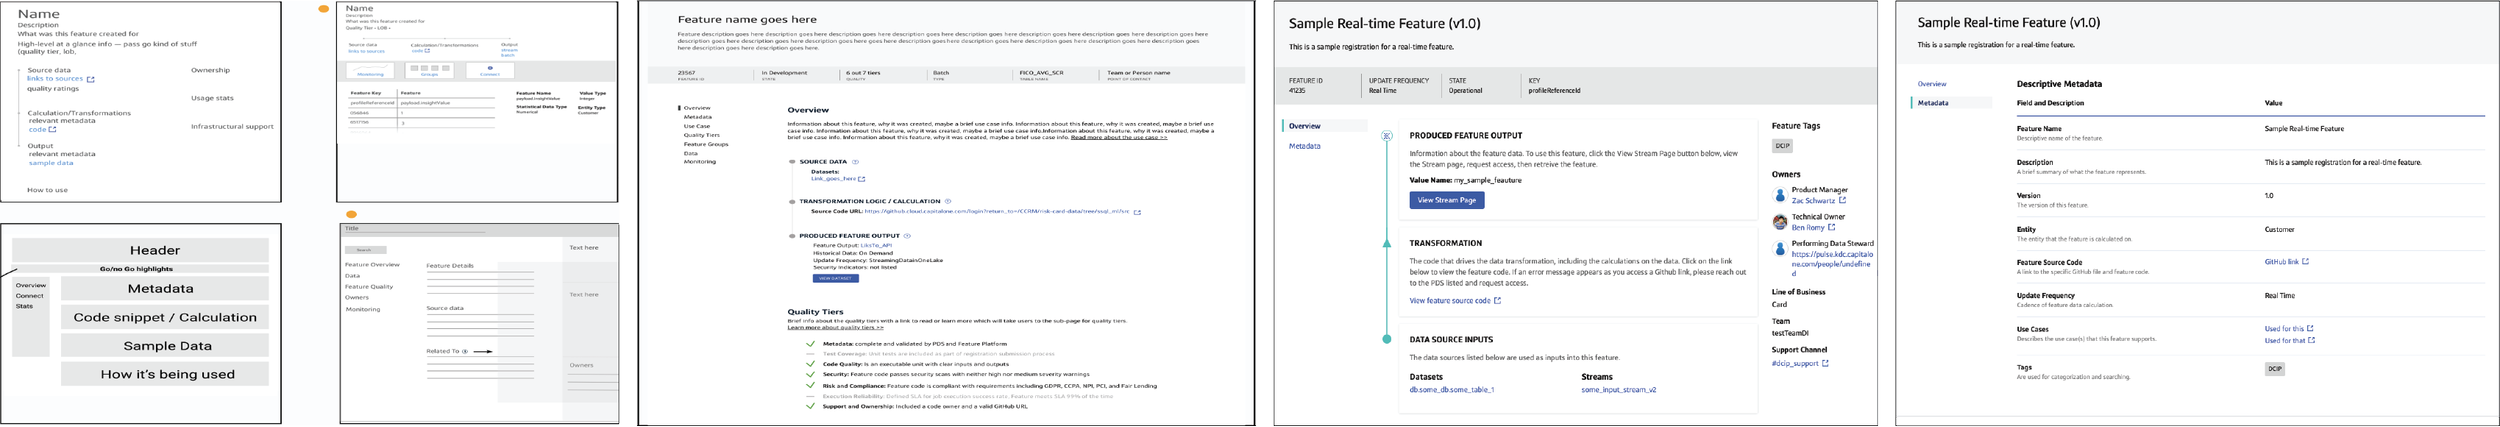
Interview sessions begun with having users share their role and how they used features by providing a use case. Users were then provided a link to a prototype mimicking the internal ecosystem website and gave them a query to add to the search box, which displayed a set of results.
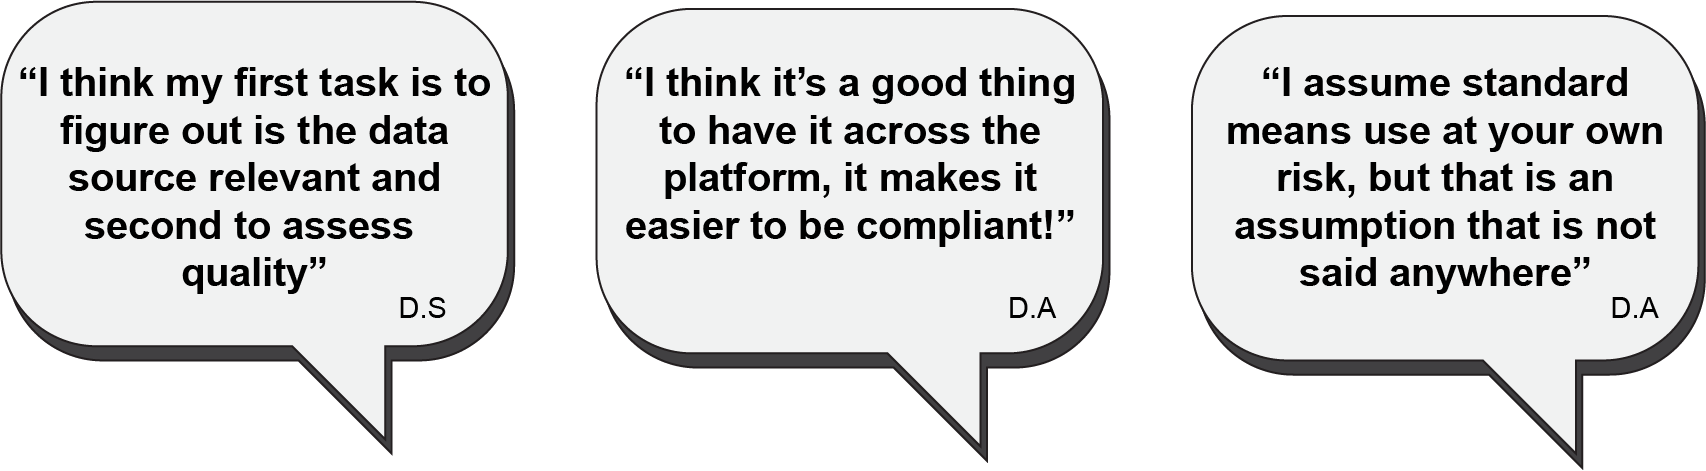
Users were asked how they would go about differentiating the quality between features on the search results page and probed further what the ranking tiers, and descriptions meant to them.
Once a search result was selected users were taken to an overview page for the selected feature and tasked with how they would go about finding more information about the quality of a feature.
If users also fulfilled the role of producers, task questions included what their thoughts were on the ranking tiers with descriptions and whether they had any concerns in fulfilling them.
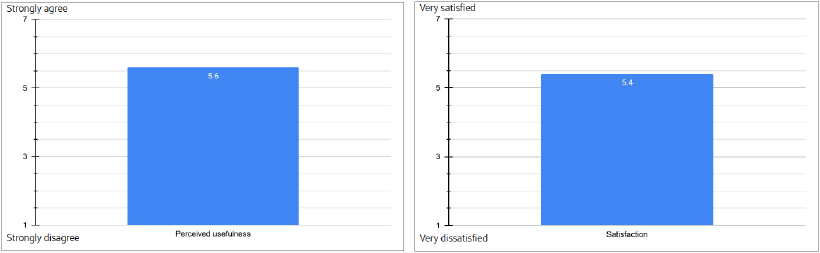
Lastly users were asked how useful and satisfied they were with the framework in meeting their goals.
Insights:
1. When prompted to use the platform to access the level of quality between features on the results page, most users were able to differentiate between levels of quality. However, all users needed further information in regard to the differences between a Platinum and Standard feature.
2. The term Standard had different connotations to users and did not equate to high quality. Some users were skeptical on their use of a Standard feature and associated it with higher risk.
3. Most users found the quality criteria relevant. Descriptions reflected what they should expect to measure.
4. 3 of 7 users would have liked to see an indication of usage and or popularity to help them trust a feature.
Overall Ratings:
Perceived Usefulness:
- As can be seen from the graphs above users found the framework helpful and useful.
- Users would have liked to see the criteria populate sooner on the search results page, especially if they are looking at numerous results.
Satisfaction:
- Users were satisfied with the framework, however, some users mentioned there being room for improvement, specifically in how the framework is executed. For instance transparency in how each criteria is met.
- A few users would have liked to see the actual criteria number that have been met with the title of the feature. For instance replacing Standard with 4-7.
Recommendations:
1. Naming convention: alternative word pairings should be considered and tested further for understanding.
2. On the search results page, a, “show more” link would be included and when expanded would provide the criteria.
3. Green checked icons were added to help users quickly access which criteria were achieved, creating further contrast.
4. A redesign of the overview page to accommodate further feature platform needs.
Part 2: Redesign of the Overview Page and New Metadata Page
Goal: Brainstorm on ideas and creative solutions (using Mural) for the feature platform overview page that will accommodate current and future needs, while working hand in hand with the enterprise design system.
Challenge: As the feature platform evolves and content increases, the existing card design becomes unsustainable and may not accommodate future needs.
Outcomes: generate design solutions that tackle the design problem that would help in creating low/medium fidelity wireframes to socialize with partners.
User Pain points: data access, lack of best practices/standards, lack of trust in the data, reliance on tribal knowledge/SME’s, keeping track of data changes.
User Needs: data quality/standards, data freshness, transparency in ownership, clear access to source code and actual calculations.
Competitive Analysis:
As the design lead, I planned and facilitated a two day workshop with the team that also involved designers from the enterprise design system. We looked at the current design and what was missing. We also looked at similar data rich sites that were trying to solve for the same thing. How do they organize information that is easily digestible. Our users needed quick access to the feature (output) and looking through the source code to make sure this is a feature they wanted to consume. Previous research on the feature platform, showed that users spent a lot of time trying to access the quality of the data and request for access.
