Monthly Business Review Generative Research
Project: Reimagining the Monthly Business Review Experience
Target User: Business Owners, Product Managers, Data Analysts, Data Scientists
Goal: Make the overall process of the monthly business review more usable, discoverable and flexible using near real time data.
Role: UX Researcher, Workshop Facilitator, UX
Goal: The goal of this generative research was to get a better understanding of the users perceptions, preferences, expectations and needs when it comes to the monthly business review process and how we can make it more usable, discoverable and flexible.
Challenge: The current system set in place was static, looking at backwards metrics, anchoring to the last 30 days of performance. This process was very time consuming and requiring the majority of a Data Analysts time and energy to pull all the information. This process also lead to the inability to flag performance issues at time of anomaly.
Outcomes: generative research, research report findings and recommendations, workshop with partners to realign on goals, present research findings, and the creation of storyboards that documented the flow of each archetype.

21 Empathy Interviews
3 Archetypes:
Business Owners
Product Managers
Data Analysts
Empathy sessions consisted of questions that revolved around key tasks users were trying to complete. Who were users collaborating with to get their jobs done. What were there needs or ultimate goals they were trying to achieve. What concerns might they be experiencing that they want to overcome and finally how were the users feeling about their overall experience, what really matters to them.

Pain Points
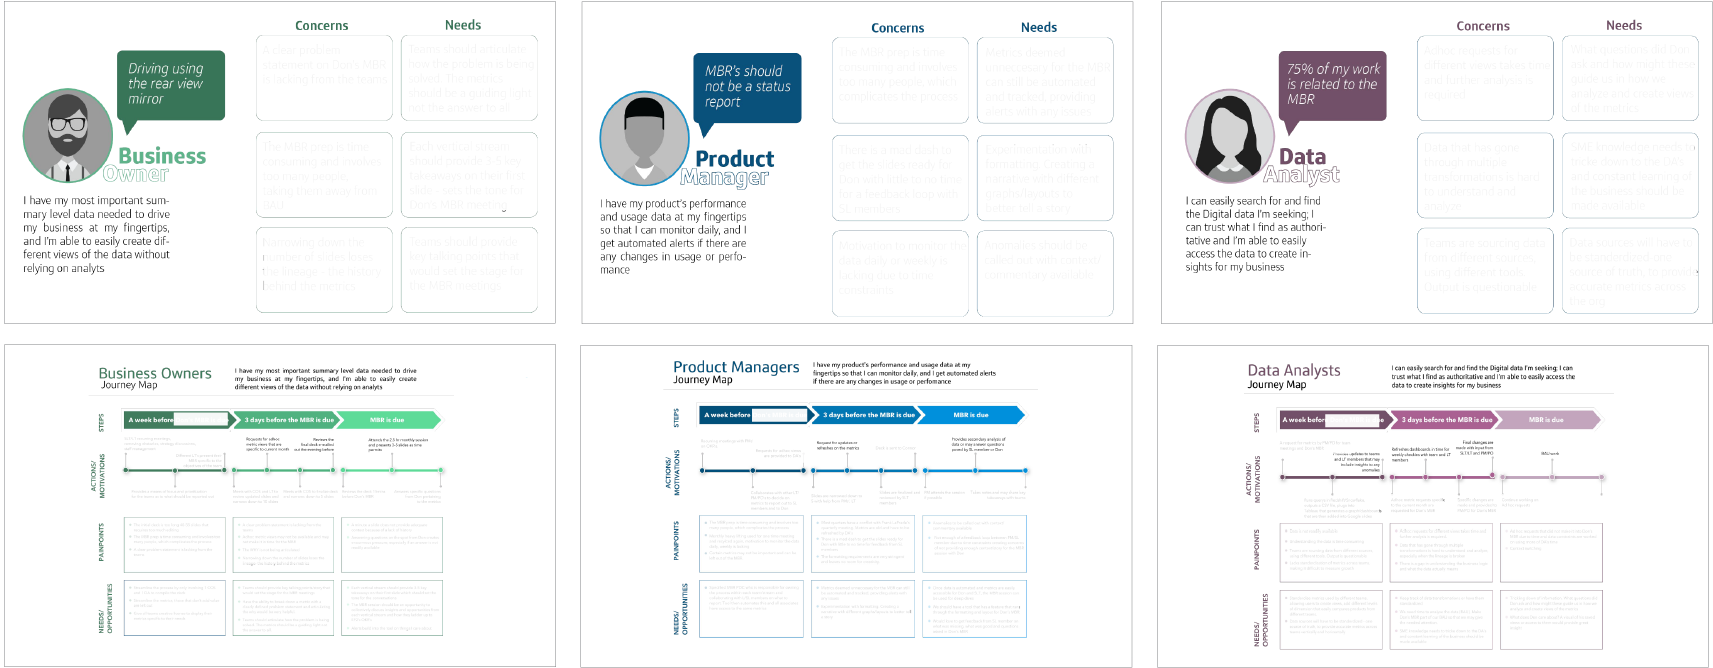
During the interviews it became apparent that the data analysts had several pain points around data. They did not trust it. Data that had gone through multiple transformations was hard to understand and analyze. Lots of time was taken in cleaning the data and creating necessary joints to make insights easier. This process of pulling data from different teams and building visualizations for the monthly business report was very time consuming as is seen from the first quote. On the other hand, business owners had their own concerns, namely, the teams were missing the ability to break down metrics with clearly defined problem statements articulating the why. In addition the report consisted of too many slides, providing very little time per slide, which meant the history was lost in translation.

User Needs
During synthesis, each archetype voiced user needs that would help make their job a little easier. As seen above the journey maps and archetype pain points and needs where articulated in the images and were used to help drive the workshop.
Data analysts collectively wanted to know what these MBR sessions were like and what the business owners where asking, what views or metrics they heavily focused on. On the other hand business owners needed teams to articulate how the problem was being solved. The metrics should be a guiding light not the answer to all.
Workshop
We held a one day workshop with stakeholders to realign on goals, present research findings and begin to develop solutions to what this new process or tool could be. One of the activities we had the participants perform was the fishbone activity. This helped in brainstorming to identify possible causes of the problems that each one of the archetypes was experiencing and their effects.

What did success look like across all archetypes:
A self service tool that is interactive and easy to use
Smart metrics with the ability to create alerts specific to archetype
Responsive visualizations with different views and time blocks
The ability to add notes, share views, and save for the MBR
Filters that include the ability to drill down to transformed metrics
